📊 Instant CSV Data Quality Reports
Upload a file, grab a coffee, and come back to a full audit — all in your browser, no backend, no signup.
Takes just seconds to load your dataset and start the full analysis process.
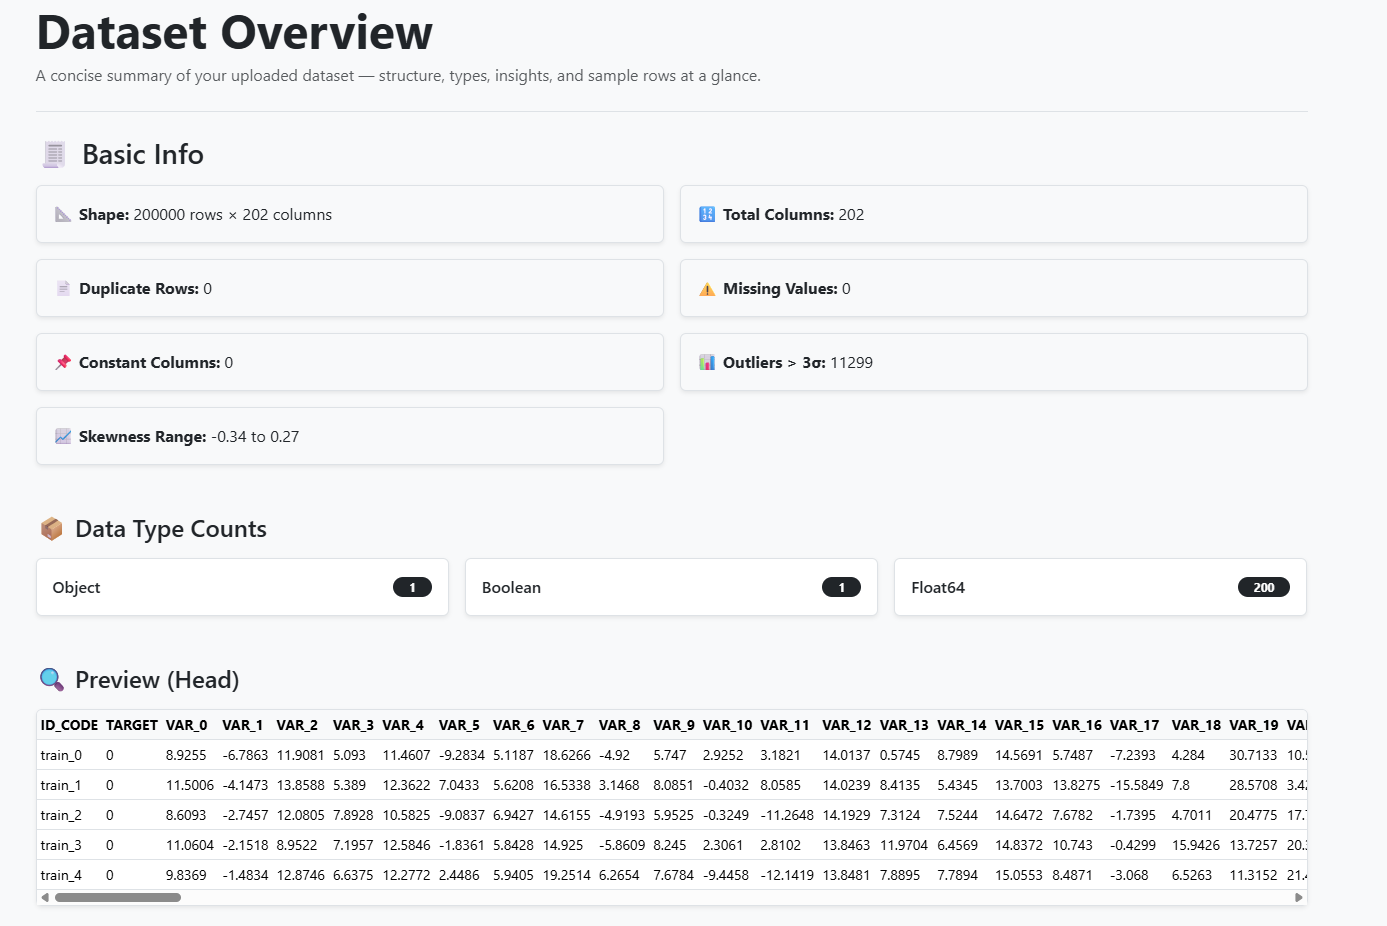
1. Data Overview
Click to view full screen
High-Level Overview in Seconds
Instantly see the structure and health of your dataset: rows, columns, nulls, outliers, skewness, and more — all in a scrollable dashboard.
- 📐 Rows × columns, column data types
- ⚠️ Null counts, duplicates, constants
- 📈 Outlier counts (3σ+) & skewness range
- 👀 Table preview with column names and types
2. Datatype/Statistical Analysis
Click to view full screen
Smart Per-Type Breakdown
We break your dataset into numeric, categorical, and boolean types and run deep stats — no plots, just actionable structure.
- 📊 Mean, std, skew, kurtosis, min/max for numerics
- 🔢 Category counts & imbalance detection
- 🧮 Boolean distributions & missing detection
- 🔍 Outlier thresholds across σ-levels
3. Quality Checklist
Full Data Quality Checklist
Statistical diagnostics spot problems fast — and we explain every flag.
We run a full battery of automated checks to identify issues and give recommendations — no config, no fuss.
- ⚠️ Null Column Check: Flags all columns with missing values
- 📉 Class Imbalance Check: Detects dominant categories (95%+ skew)
- 🪞 Duplicate Column Check: Identifies identical feature columns
- 🔁 Duplicate Row Check: Spots repeated rows in the dataset
- 📎 Multicollinearity Check: Warns for high VIF (>10) in numeric fields
- 📈 High Correlation Check: Detects highly correlated feature pairs (> 0.95)
- 🚫 Constant Column Check: Flags columns with a single repeated value
- 🎭 High Cardinality Check: Identifies categorical columns with 50+ unique labels
- 📊 Low Variance Check: Highlights numeric columns with zero variance
Click to view full screen
Audit While You Brew
Start a full audit now. It runs in-browser, takes seconds, and tells you exactly what’s wrong — while you sip your coffee.
🚀 Launch the App